

The evolution of poverty in Mozambique (poster)
HIGHLIGHTS
- Consumption Poverty (CP) decreased until 14/15, but then increased sharply until 19/20.
- Multidimensional Poverty (MP) steadily improved, reducing to about half of its 96/97 level in 19/20.
- The South is multidimensionally less poor than the Center and North, both in terms of multidimensional levels and multidimensional evolution.
INTRODUCTION
- This poster summarizes IGM program studies on multidimensional and consumption poverty using Household Budget Survey (IAF/IOF) data from 1996/97 to 2019/20.
- The studies use the cost of basic needs and the Alkire-Foster approach.
- CP is determined by setting a poverty line based on the cost of acquiring a basic basket of (non-)food items. Families with consumption levels below this line are classified as poor.
- MP considers more than consumption: health, education, housing quality, ownership of durable goods.
- MP is calculated by assessing if families are deprived in each indicator, weighting the indicators based on their relative importance, and establishing a cutoff to distinguish between poor and non-poor households.
RESULTS
Consumption poverty
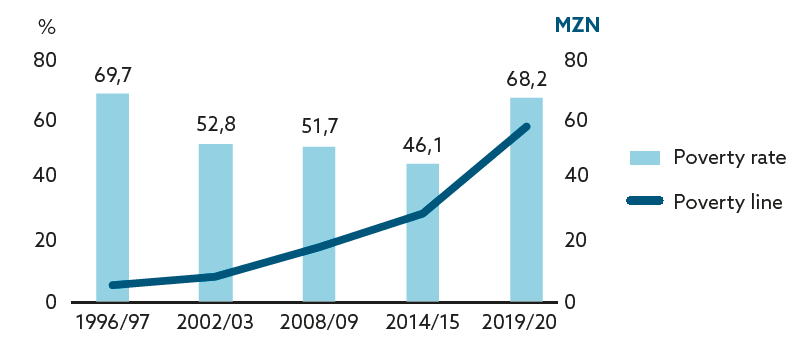
Consumption poverty notably decreased from 70% in 1996/97 to 53% in 2002/03, remained stable until 2008/09, then dropped to 46% in 2014/15. Next, there was a significant rise to 68% in 2019/20 (see Figure 1).
Simultaneously, the poverty line increased from 5.5 in 1996/97 to 58.4 MZN/person/day in 2019/20.
Rapid economic growth is associated with the reduction in consumption poverty until 2014/15. Factors such as the “hidden debt” scandal, climate shocks, the Covid-19 pandemic, and decreased commodity exports are linked to the increase in consumption poverty after 2014/15.
Figure 1:
Consumption Poverty Incidence and Poverty Line
Multidimensional poverty
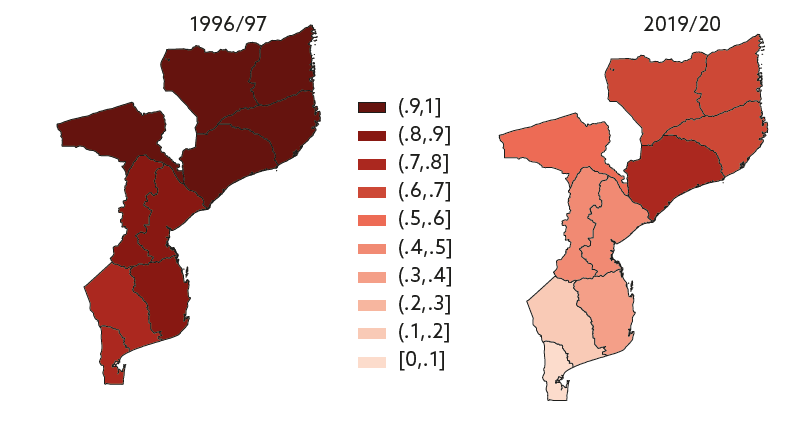
Multidimensional poverty has consistently decreased, showing a significant 33PP reduction from 1996/97 to 2019/20. MP is less vulnerable to shocks, attributable to its association with structural changes such as infrastructural improvements and increases.
Figure 2 illustrates the decline of multidimensional poverty over time while also highlighting provincial disparities. The South exhibits lower levels of MP compared to the Center and North, both in terms of levels and the progression of multidimensional poverty.
Figure 2:
Multidimensional Poverty Incidence (%)
POLICY OPTIONS
- Inclusive economic, social, regional and infrastructural policies are needed.
- Guarantee well-designed social protection systems.
- Prioritize agriculture, agribusiness and smallholders.
- Access to market, credit and extension is needed.
- Consider the local context and traditional knowledge.
REFERENCES
- Cardoso, J., Morgado, J., and Salvucci, V. (2016). Mapping deprivation in Mozambique: An analysis of census data (1997–2007)
- Bérenger, V. (2017) The counting approach to multidimensional poverty: The case of four African countries
- Mahrt et al. (2018) Multidimensional poverty of children in Mozambique
- Egger, E., Salvucci, V., and Tarp, F. (2020) Evolution of multidimensional poverty in crisis ridden Mozambique
- Arndt et al. (2016) Evolution of Poverty and Wellbeing in Mozambique
- DEEF (2016) Poverty and wellbeing in Mozambique: Fourth National Evaluation
- Arndt, Hussain and Østerdal (2012) Effects of Food Price Shocks on Child Malnutrition: The Mozambican Experience 2008/09
- Cardoso, J., Allwright, L., and Salvucci, V. (2016) Characteristics and determinants of child malnutrition in Mozambique, 2003–11
- Ibraimo, M., and Salvucci, V. (2016) The Determinants of Poverty in Mozambique, 2014/15
- Mambo et al. (2018) Simulating the effect on households’ real consumption and poverty of the increase in prices that followed the 2015–16 economic crisis in Mozambique
- Salvucci, V., and Santos, R. (2019) Vulnerability to natural shocks
- Barletta et al. (2021) The impact of COVID-19 on consumption poverty in Mozambique
- Squarcina, M., and Egger, E. (2022) Effects of the COVID-19 crisis on household food consumption and child nutrition in Mozambique
- Ibraimo, M., and Egger, E. (2023) Migration out of poverty: The case of post-war migration in Mozambique
- Bazo et al. (2021) Universal benefits for children aged 0–2 as a strategy to reduce poverty and inequality in Mozambique
- Chelengo, M., Cardoso, J., and Mataba, G. (2021) Expanding social protection in Mozambique (in Portuguese): Simulating different scenarios for PSSB upgrade and expansion
Download the poster here
AUTHORS

Hilário Muchabel

Telça Massingue
UNU-WIDER
April 2024
RELATED EVENT